
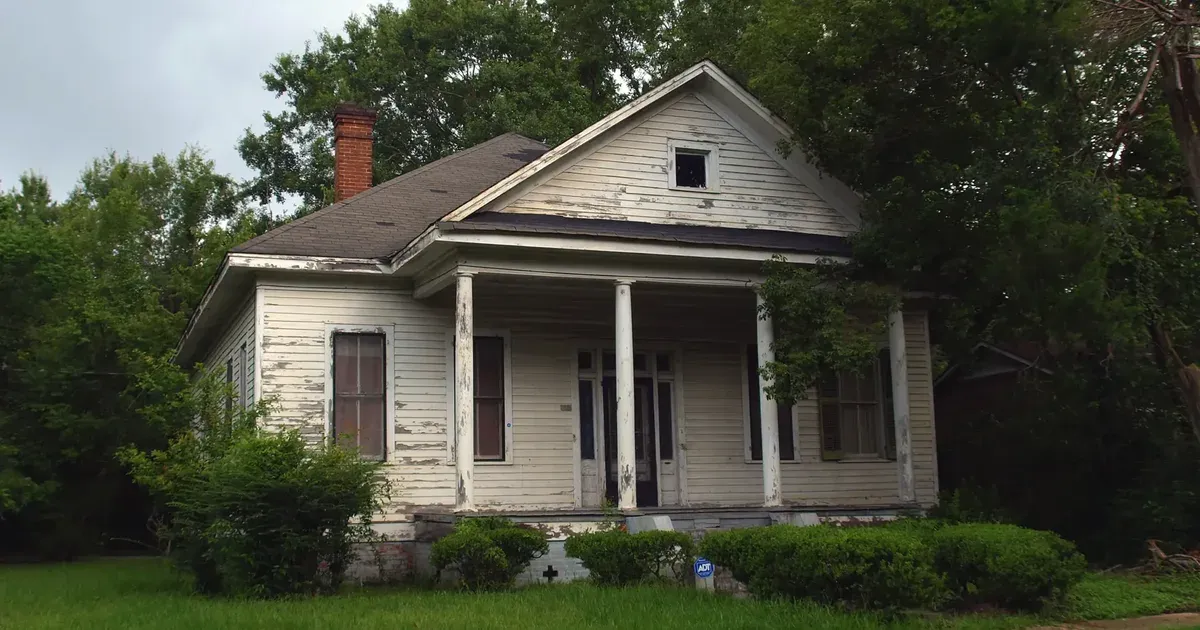
St. Joseph prices eased in 2026: Redfin's median sale was $185,871 through October, down 2.2%, and sales took 28 days, up from 24.
Zillow's typical value for the city rose 2.9% to $180,050 over the same year, because it measures all houses, not just the ones that sold. Missouri sets new assessed values as of January 1, 2027, and the City is updating its FEMA flood maps.
This is general information, not legal advice. State rules vary.
Jump to a section
When are you hoping to sell your St. Joseph house?
Free. No obligation. You choose the closing date.
St. Joseph, Missouri, the county seat of Buchanan County, sends two price signals in 2026. Redfin's median sale price for the three months ending October 2026 was $185,871, down 2.2% from a year earlier. Zillow's typical value for the city rose 2.9% over the same year.
This guide to the St. Joseph MO housing market in 2026 sets both sources side by side, with ZIP code values and the time it takes to sell. It also covers two things that can shape a sale: the 2027 reassessment and the new flood maps. Every figure carries its source and month, and none of it is a forecast.
What does the St. Joseph, MO housing market look like in 2026?
St. Joseph prices dipped slightly in 2026, and sales slowed. Redfin's median sale price was $185,871 for the three months ending October 2026, down 2.2% from a year earlier, and the median sale took 28 days, up from 24.
Redfin's St. Joseph housing market page lists 262 houses sold in October 2026, down from 274 in October 2025. Redfin also says the city's median sale price is 56% lower than the national average. The table collects the main figures from that page.
| Redfin metric, St. Joseph, MO | October 2026 | Change from a year earlier |
|---|---|---|
| Median sale price (three months ending October) | $185,871 | -2.2% |
| Houses sold in October | 262 | -4.3% (274 a year earlier) |
| Median days on market | 28 | +4 days (24 a year earlier) |
| Sale-to-list price | 97.9% | +0.3 points |
| Sold above list price | 28.9% | -0.64 points |
| Listings with a price drop | 39.0% | -0.9 points |
Redfin rates St. Joseph “somewhat competitive,” with a Compete Score of 43 out of 100. By Redfin's count, the average house sells for about 2% below list price and goes pending in around 29 days.
Which St. Joseph these numbers cover
Every figure here is for St. Joseph, Missouri. Redfin files the city as “St. Joseph, MO,” and Zillow files it as “Saint Joseph” in Buchanan County. Numbers for St. Joseph, Michigan, or any other St. Joseph do not appear in this guide.
How have St. Joseph house prices moved in 2026?
St. Joseph house prices climbed through spring and summer 2026, then eased in the fall. On Redfin's three-month measure, the median rose from $170,000 in the window ending January to $193,750 in the window ending August, then slipped to $185,871 by October.
| Three months ending (2026) | Redfin median sale price | Change from a year earlier | Median days on market |
|---|---|---|---|
| January | $170,000 | +5.6% | 35 |
| February | $182,500 | +14.1% | 33.5 |
| March | $188,000 | +10.6% | 38 |
| April | $185,000 | +12.1% | 38 |
| May | $185,000 | +11.4% | 30 |
| June | $189,500 | +8.3% | 22 |
| July | $191,500 | -4.3% | 19 |
| August | $193,750 | -3.1% | 20 |
| September | $192,500 | -4.9% | 27.5 |
| October | $185,871 | -2.2% | 28 |
The year-over-year column tells a sharper story. Every window from January through June ran above the year before, by as much as 14.1% in the window ending February. From July on, each window ran below the same stretch of 2025.
Part of that turn comes from a strong 2025. Redfin's window ending October 2025 had a median of $190,000, up 13.8% on the year before it. A small market like this one can swing on a few dozen sales, so one window rarely settles the trend.

Why do Redfin and Zillow disagree about St. Joseph?
Redfin and Zillow measure different things, so they can move in opposite directions. Redfin's median reflects the houses that actually sold in a three-month window. Zillow's Home Value Index estimates the typical value of all houses in the city, sold or not.
Zillow's Home Value Index for the City of St. Joseph was $180,050 in October 2026, up 2.9% from $174,915 a year earlier. It peaked at $182,586 in May 2026 and has edged down each month since. Over five years, the index rose 26.2%, from $142,698 in October 2021.
The two sources are never blended here, and neither one is an appraisal of a single house. For the bigger picture across the state, the Missouri housing market guide compares the larger cities.
What are St. Joseph house values by ZIP code?
Zillow's typical values across St. Joseph's six ZIP codes ranged from $125,675 in 64501 to $275,293 in 64506 in October 2026. Five of the six rose from a year earlier, while 64504 fell 3.1%.
| ZIP code | Zillow typical value, October 2026 | Change from October 2025 |
|---|---|---|
| 64501 | $125,675 | +5.1% |
| 64503 | $172,831 | +3.0% |
| 64504 | $130,232 | -3.1% |
| 64505 | $220,148 | +3.8% |
| 64506 | $275,293 | +4.6% |
| 64507 | $164,520 | +2.5% |
These are ZIP code figures, not neighborhood values. ZIP lines do not follow neighborhood or historic district lines, so a ZIP value says little about one block. It also averages many kinds of houses, from brick houses a century old to much newer ones.
A house inside one of the City's historic districts can face design review before exterior changes. The guide to selling a house in a St. Joseph historic district covers that process.
How long does it take to sell a house in St. Joseph?
The median St. Joseph sale spent 28 days on the market in the three months ending October 2026, four days longer than a year earlier (Redfin). Spring was slower still: the windows ending March and April 2026 each ran a 38-day median.
Days on market stop when a buyer's contract is accepted. Closing comes after that, so the full stretch from listing to cash in hand runs longer than the median suggests.
Pricing plays a part too. In the window ending October 2026, 39.0% of St. Joseph listings took a price drop, and the sale-to-list ratio was 97.9%. About 28.9% of sales closed above list price. If a listing has already sat through a price cut, the options for a house that won't sell may help.
Is it a good time to sell a house in St. Joseph, MO?
It can be, but the answer depends more on your house and timeline than on the calendar. Redfin's October median sat 4.1% below its 2026 high, Zillow's value sat 1.4% below its May peak, and sales take longer than a year ago.
No one can say where prices go next, and this guide does not try. What the 2026 figures do show depends on the seller:
- Sellers who can wait: Redfin's windows ending July and August 2026 were the quickest, at 19 and 20 days. The windows ending March and April were the slowest, at 38.
- Sellers holding an empty or inherited house: each month adds taxes, insurance, and utilities. The guide to selling an inherited house in St. Joseph covers the estate side.
- Sellers who want a firm number first: a cash offer can sit beside a listing plan. The St. Joseph cash sale page explains how that works.
What do the 2027 reassessment and new flood maps mean for a St. Joseph sale?
Missouri sets new assessed values as of January 1, 2027, and St. Joseph is updating its FEMA flood maps. Both can change what a buyer sees when they look up a house.
Reassessment in 2027
Missouri assessors reset values every odd-numbered year under RSMo 137.115. The statute spells out the timing:
"new assessed values shall be determined as of January first of each odd-numbered year and shall be entered in the assessor's books"
RSMo 137.115.1, Missouri Revised Statutes
Those values carry into the following even-numbered year, so a 2027 value also applies in 2028. Residential property, subclass (1) under the Missouri Constitution, is assessed at nineteen percent of true value (RSMo 137.115.5). A new value alone does not set a tax bill, since local levies also count.
Flood maps and the Missouri River
The City says it and Buchanan County “are in the process of updating the FEMA and NFIP flood maps for the area.” Its Proposed Flood Maps page explains how to find the preliminary map panel for a given area on FEMA's Map Service Center.
The National Weather Service gauge for the Missouri River at St. Joseph sets minor flood stage at 17 feet and major flood stage at 27 feet. Its highest recorded crests reached 32.07 feet in July 1993 and again in March 2019.
Redfin's climate panel, using First Street data, says “1,235 properties in St. Joseph are likely to be severely affected by flooding over the next 30 years,” about 5% of the total. That is a model estimate, not a statement about any one house. Checking the panel by address can answer a buyer's first question before it comes up.
How can Propcash help a St. Joseph seller?
Propcash is a direct cash homebuyer, and we buy St. Joseph houses as-is, with no repairs, cleaning, or showings. We'll make you one cash offer based on local market data and show you how we got to our number. You pick the closing date, which can be as few as 7 days after the contract is signed.
A Propcash offer can sit next to a listing plan and the figures above, so you can compare them on your own time. Our offer stands, with no obligation, no fees, and no follow-up calls unless you want them. If a cash sale isn't your best move, we'll tell you. You can get a cash offer on your St. Joseph house.
Frequently Asked Questions
Is St. Joseph, Missouri the same market as St. Joseph, Michigan?
No. St. Joseph, Missouri is the county seat of Buchanan County on the Missouri River, and the figures in this guide come from Redfin's “St. Joseph, MO” page and Zillow's “Saint Joseph” city row for Buchanan County. St. Joseph, Michigan is a separate city with its own market, and none of its numbers appear here.
How do St. Joseph prices compare with the national average?
Redfin says St. Joseph's median sale price is 56% lower than the national average, based on the three months ending October 2026. The St. Joseph median in that window was $185,871. Redfin also puts the city's overall cost of living 7% below the national average.
Which St. Joseph ZIP code has the highest typical value?
ZIP 64506 had the highest Zillow typical value of St. Joseph's six ZIP codes in October 2026, at $275,293, up 4.6% from a year earlier. ZIP 64501 had the lowest, at $125,675, though it rose the most, 5.1%. These are ZIP-wide figures and do not describe any single neighborhood or house.
Do St. Joseph houses sell for the asking price?
Most sell a little under it. Redfin put St. Joseph's sale-to-list ratio at 97.9% for the three months ending October 2026, and 28.9% of sales closed above list price. In the same window, 39.0% of listings took a price drop.
When will Missouri set new assessed values for St. Joseph houses?
Missouri assessors set new values as of January 1, 2027, because RSMo 137.115 calls for new assessed values as of January first of each odd-numbered year. Those values also apply in 2028. Residential property is assessed at 19% of its true value.
How much of St. Joseph faces severe flood risk?
Redfin's climate panel, built on First Street data, says “1,235 properties in St. Joseph are likely to be severely affected by flooding over the next 30 years,” about 5% of the total. That is a model estimate, not a finding about any one house. The City's Proposed Flood Maps page explains how to find the preliminary FEMA map panel for an area.
Does Propcash buy St. Joseph houses that need repairs?
Propcash can make a cash offer on a St. Joseph house in any condition, with no repairs, cleaning, or cleanout needed from you. The offer is based on local market data, and we show how we got to the number. There are no agent commissions or fees charged to you.
Reviewed by the Propcash Editorial Team under our editorial standards. Published by Propcash, a direct cash buyer of houses. This guide is general information. Laws, fees, and market figures change, so check the current rules for your state.